
सीधा जवाब
CPU 100% दिखने पर पहले spike का UTC time, प्रभावित websites और उस समय की requests को एक साथ देखें। केवल CPU graph से bot attack, slow PHP या cron job का निष्कर्ष नहीं निकाला जा सकता। पहले correlation बनाएं, फिर एक controlled change करके परिणाम मापें।
यह guide production site पर destructive changes किए बिना diagnosis शुरू करती है। नीचे के Hostinger screenshots उसके Help Center के वास्तविक reference screenshots हैं; इनमें दिख रहा traffic आपकी website का live traffic नहीं है। पुराने UI में आज के dashboard से अंतर हो सकता है।
1. Spike का time window और log evidence निकालें
Hostinger में Websites → संबंधित Dashboard खोलें। Resources Usage में spike का समय और लागू plan देखें। Shared plan में कई websites का resource usage aggregated हो सकता है; इसलिए एक site का log पूरे plan की समस्या नहीं समझाता। Graph का समय और log timezone मिलाना जरूरी है। Hostinger के अनुसार usage UTC में दिखता है और historical data में लगभग 10–15 मिनट की refresh delay हो सकती है।
Analytics → Access Logs में उसी interval की requests देखें। URL, method, response time, status, source IP और user agent को दर्ज करें। उपलब्ध UI से जो fields मिलें उतनी ही लें; assumed fields न जोड़ें।
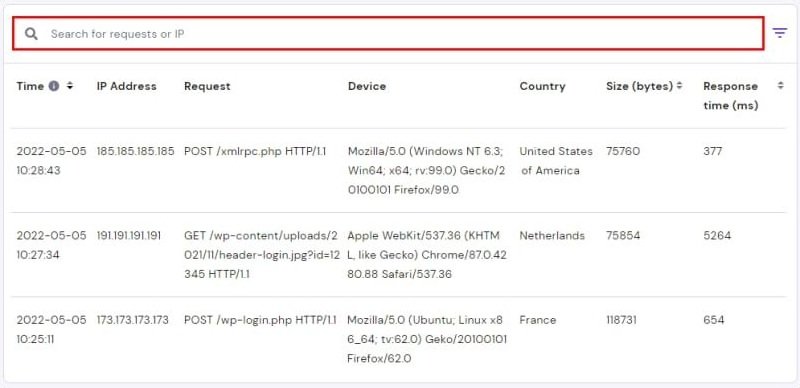
स्रोत: Hostinger Help Center, वास्तविक reference screenshot; आपकी site का data नहीं।
एक छोटा incident record बनाएं: spike शुरू होने का समय, duration, plan में sites की संख्या, prominent endpoints और visitor complaints। Screenshot में दिख रहे xmlrpc.php या wp-login.php की मौजूदगी अपने आप attack का प्रमाण नहीं है। Request rate, legitimate usage और response cost साथ देखें।
2. Filters से request pattern अलग करें
IP, request और available time filters से repeated endpoints खोजें। केवल country या user agent के आधार पर block न करें: VPN, shared networks और spoofed agents diagnosis को भ्रमित कर सकते हैं। एक IP की सामान्य checkout requests भी महंगी हो सकती हैं, जबकि हजार static cache hits सस्ते हो सकते हैं।
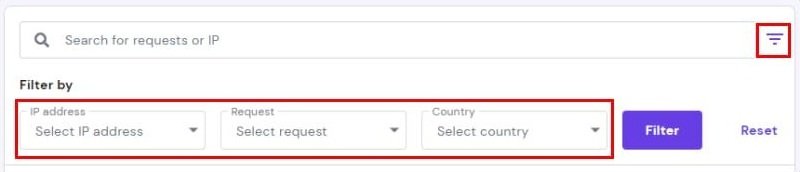
स्रोत: Hostinger Help Center; historical dashboard controls का उदाहरण।
हर संदिग्ध endpoint के लिए पूछें: क्या यह cache bypass करता है? क्या login state, search query या cart request से PHP execution होता है? क्या same request बार-बार आती है? Rate और response time दोनों बढ़े हैं या सिर्फ volume?
अगर export उपलब्ध हो तो sensitive query strings redact करके endpoint-wise counts निकालें। Client IP को केवल आवश्यक audit तक रखें। User agent में Googlebot लिखा होना verified crawler identity नहीं है; crawler verification के लिए official Google procedure अपनाएं।
3. 5xx errors और application timings को मिलाएं
उसी समय के 5xx chart को access logs और PHP error log के साथ देखें। Spike के बाद errors आए तो capacity exhaustion hypothesis मजबूत हो सकती है; errors पहले आए तो failing upstream या retry loop traffic बढ़ा सकता है। HTTP 500, 502 और 503 को एक ही cause न समझें।

स्रोत: Hostinger Help Center; दिखी error counts आपकी website की measurements नहीं हैं।
| Evidence | संभावित कारण | अगली जाँच |
|---|---|---|
| Login endpoint पर repeated costly requests | Bot traffic या brute-force load | WAF logs और legitimate login flow |
| कम requests पर high latency | Slow PHP, database या external API | Application trace, slow queries, timeout logs |
| निश्चित interval पर spike | Cron, backup या queue processing | Job timestamps और runtime |
| Busy workers लेकिन modest CPU | Waiting I/O या slow upstream | Response timing और concurrent requests |
PHP workers की संख्या और CPU एक ही metric नहीं हैं। Slow external API workers को busy रख सकती है। इसलिए worker limit देखकर तुरंत CPU upgrade का फैसला करना अक्सर अधूरा diagnosis है।
Cron और cache का controlled audit
Scheduled backups, imports, image optimization और WordPress cron events की timings मिलाएं। Managed cron या WP-CLI उपलब्ध हो तो event inventory पढ़ें; job disable या delete करने से पहले उसका owner और business purpose पहचानें। Overlap रोकना, batch size घटाना या noncritical work off-peak करना एक hypothesis के आधार पर करें।
एक change के बाद comparable traffic window में CPU, errors, latency और conversion path जाँचें। Checkout, login और forms को functional verification में शामिल करें। कई changes एक साथ करने से improvement का कारण पता नहीं चलता।
Upgrade कब justified है?
अगर legitimate uncached workload, repeatable concurrency और measured limits के बीच संबंध साबित हो, optimization के बाद भी capacity कम पड़े, तब upgrade या migration पर विचार करें। केवल screenshot देखकर नया plan न खरीदें। Server location और delivery path के लिए USA audience hosting guide तथा विकल्पों के लिए HostArmada vs ChemiCloud पढ़ें।
Affiliate disclosure: नीचे दिए hosting links affiliate links हैं। इनके माध्यम से eligible purchase पर WebTakniki को commission मिल सकता है। खरीदने से पहले checkout पर कीमत, renewal, limits और refund terms जाँचें। किसी diagnostic result के आधार पर provider की performance guarantee नहीं दी गई है।
Bluehost · HostArmada · ChemiCloud · FastComet · FlashCloud
FAQ
क्या CPU 100% मतलब website hacked है? नहीं। Legitimate workload, jobs और inefficient code भी कारण हो सकते हैं; security conclusion के लिए अलग evidence चाहिए।
क्या ज्यादा PHP workers हर spike ठीक कर देंगे? नहीं। Database या upstream bottleneck होने पर concurrency बढ़ाना समस्या बढ़ा सकता है।
क्या access logs root cause prove करते हैं? Logs request patterns बताते हैं। Exact execution cost जानने के लिए profiling या application/database timings की जरूरत हो सकती है।
स्रोत
Hostinger resource usage · Hostinger Analytics और screenshot source · Google crawler verification